Project Summary Table – Approver View
View a summary of your project, including Total Contract Value, Base Contract and Variation amounts, what has been Claimed and Approved, and see where Payment Schedule approvals are stuck this month
Overview
When you’re running a project, it’s key to know financially where you are each month. The Project Summary Table provides a comprehensive overview of each Contract associated with your Projects, allowing you to assess their overall status at a glance.
There are a few key states within the Project Summary table, they are described below.

- Two Claims received in the Project Group, with two Payment Schedules issued.
- One Claim received and one Payment Schedule issued with multiple approvers. You can view that Payment Schedule if there is only one issued in the month. If multiple Payment Schedules are issued you will have to view them in the project itself.
- One Claim received and one Certificate issued with no approvers required.
- Approval is overdue by 3 days because it is still in draft status waiting for multiple approvers to take action.
- Approval not issued and Payment Schedule is due in 7 days.
- All claims are up to date in the Project Group with no new outstanding Claims.
- No claims to date in the Project Group.
- Payment Schedule currently with multiple approvers with one day to respond to Payment Claim.
Additional Information
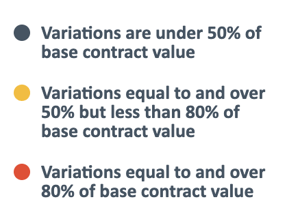
In the Total Variations / Base Contract Value column you will see circles which are pie graphs of Variations verses Base Contract values for each contract. The colours on each are defined as:

Clicking on the ![]() icon next to the header in this column will also show you this information.
icon next to the header in this column will also show you this information.
In the Claimed to Date / Approved to Date column the bar graphs shows financial progress for each Contract. The colours can be interpreted in terms of the difference between Claims coming in verses Payment Scheduled going out. The benchmark guidelines are:

Clicking on the ![]() icon next to the header in this column will also show you this information.
icon next to the header in this column will also show you this information.